Pyvista库
约 505 个字 174 行代码 8 张图片 预计阅读时间 4 分钟
安装:pip install pyvista。
创建Mesh对象
PolyData数据结构
这种方式绘制的是mesh face,而不是实体单元体。
UnstructuredGrid数据结构
cells = [4, 0, 1, 2, 3] # 四面体单元,第一列为单元节点数,后面为节点编号
celltypes = [pv.CellType.TETRA] # 单元类型,与cells一一对应
points = [
    [1.0, 1.0, 1.0],
    [1.0, -1.0, -1.0],
    [-1.0, 1.0, -1.0],
    [-1.0, -1.0, 1.0],
]
grid = pv.UnstructuredGrid(cells, celltypes, points)
grid.plot(show_edges=True)
导入vtk文件
导入inp文件
常见查询方法
import pyvista as pv
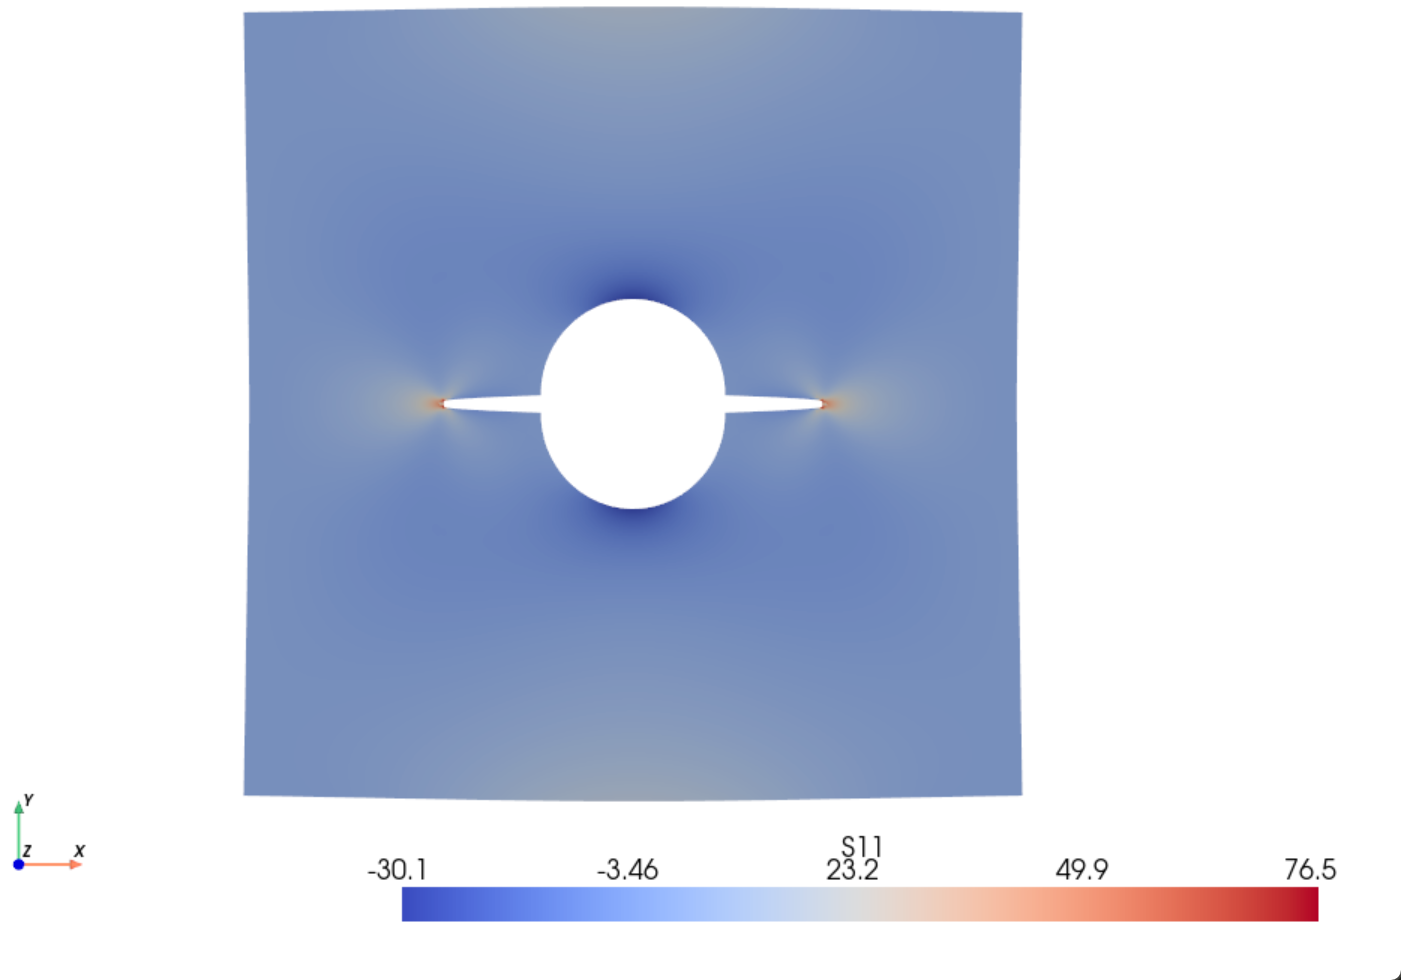
mesh = pv.read('CRACK.vtk')
print('node number = ',mesh.n_points)
print('element number = ',mesh.n_cells)
print('node coordinate = ',mesh.points[0])
print('point_data = ',mesh.point_data)
输出:
node number =  66429
element number =  65726
node coordinate =  [-19.362562   0.057323   0.      ]
point_data =  pyvista DataSetAttributes
Association     : POINT
Active Scalars  : S11
Active Vectors  : U
Active Texture  : None
Active Normals  : None
Contains arrays :
    U                       float32    (66429, 3)           VECTORS
    RF                      float32    (66429, 3)
    S11                     float32    (66429,)             SCALARS
    S22                     float32    (66429,)
    S12                     float32    (66429,)
    Mises                   float32    (66429,)
- 查看有单元数:
mesh.n_cells - 查看节点数:
mesh.n_points - 节点坐标:
mesh.points - 单元编码:
mesh.cells(缩并为一维数组) - 查看 SCALARS(云图变量种类)数:
mesh.n_arrays - 查看 point data 有哪些:
mesh.point_data - 查看 point data 具体的值:
mesh.point_data['Displacement'] - 查看 cell data 有哪些:
mesh.cell_data - 查看 cell data 具体的值:
mesh.cell_data['AxialForce'] - 也可以直接查看:
mesh['Displacement']或mesh['AxialForce'] - 也可以自行添加 cell data 或者 point data:
mesh.point_data['S11'] = s11
绘图方法
绘图方法有两种:mesh.plot和pyvista.Plotter.add_mesh,个人喜欢后者,因为可以不断增添新特征,以后的教学都以后者为基础。
mesh.plot
pyvista.Plotter.add_mesh
云图绘制
import pyvista as pv
mesh = pv.read('C3D4.vtk')

dargs = dict(
scalars="U",
show_scalar_bar=False,
show_vertices=False,
show_edges=False,
# vertex_color='red',
# point_size=1,
)
pl = pv.Plotter(shape=(2, 2))

pl.add_mesh(mesh.copy(),**dargs)
pl.add_text("Magnitude Displacement", color='k')
pl.subplot(1, 0)

pl.add_mesh(mesh.copy(),component=0, line_width=2,**dargs)
pl.add_text("X Displacement", color='k')
pl.subplot(0, 1)

pl.add_mesh(mesh.copy(),component=1,render_points_as_spheres=True,**dargs)
pl.add_text("Y Displacement", color='k')
pl.subplot(1, 1)

pl.add_mesh(mesh.copy(),component=2,**dargs)
pl.add_text("Z Displacement", color='k')

pl.link_views() # link all the views
pl.show()
以上 Python 语句,相信大家只要稍微看一下就能明白。在绘图的时候可以单独设置绘图参数,比如这样:
plotter.add_mesh(mesh, scalars='Displacement', component=0,也可以使用上述代码的形式,将绘图参数集中在 dargs 的设置中。注意有以下几点:
component=0表示第一个分量,如果不设置的话,就表示合量Magnitude。- 上图的节点显示看上去有很多没有显示,在实际绘图过程中,将图片逐渐放大后,每个节点的编号都会显示出来。
render_points_as_spheres=True表示将点的形状转换为 3D 圆球状,更具观赏性。show_scalar_bar=False是为了后续定制 colorbar,如果不设置为False,后面在你定制 colorbar 时,将会出现两个 colorbar。
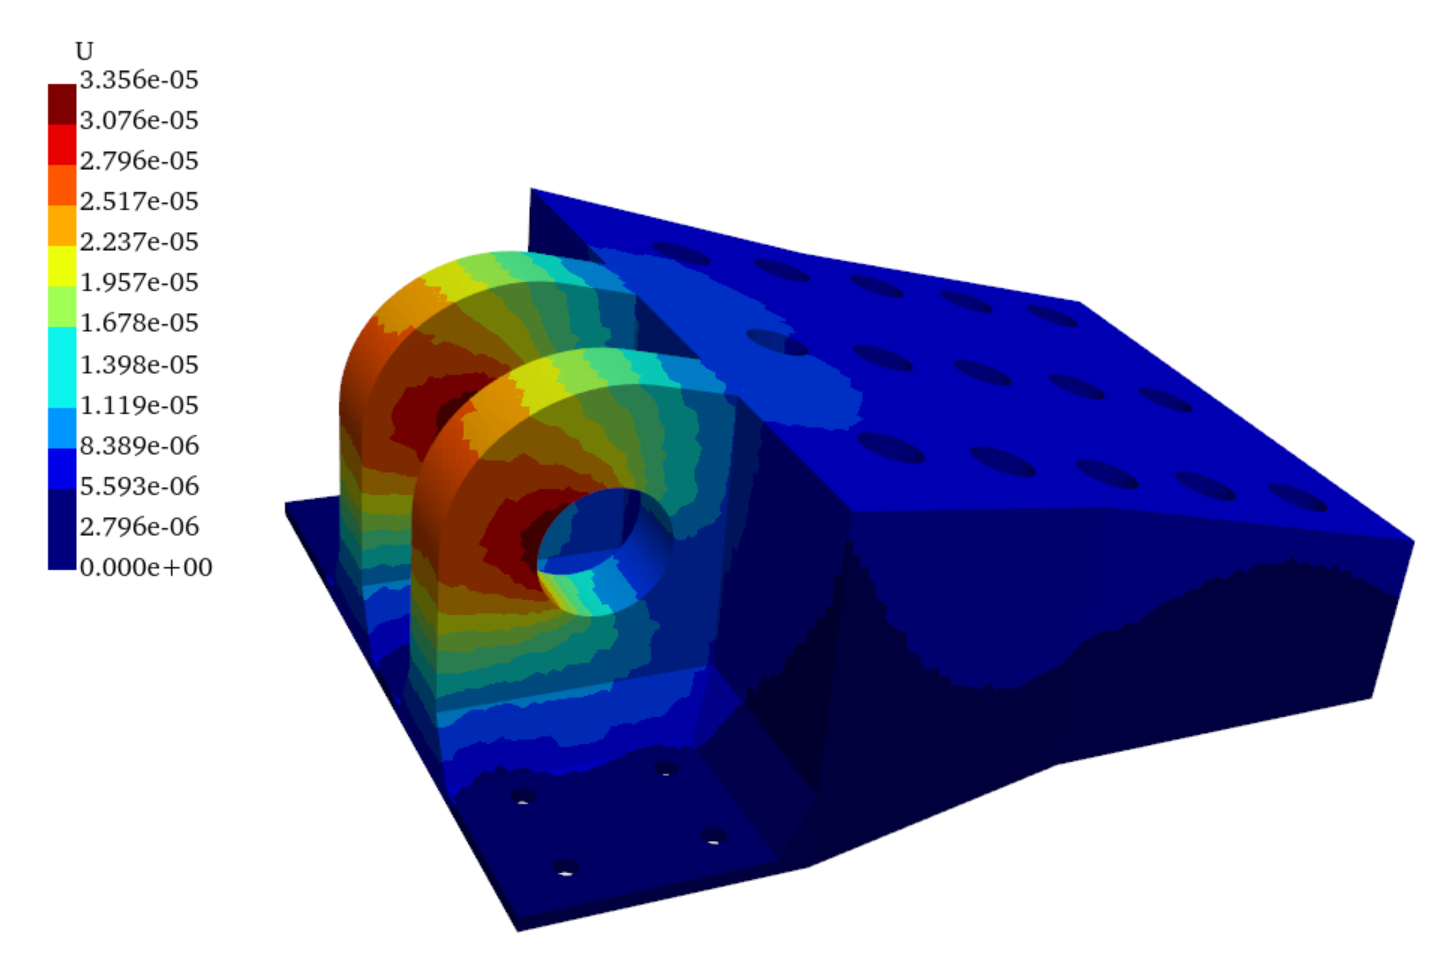
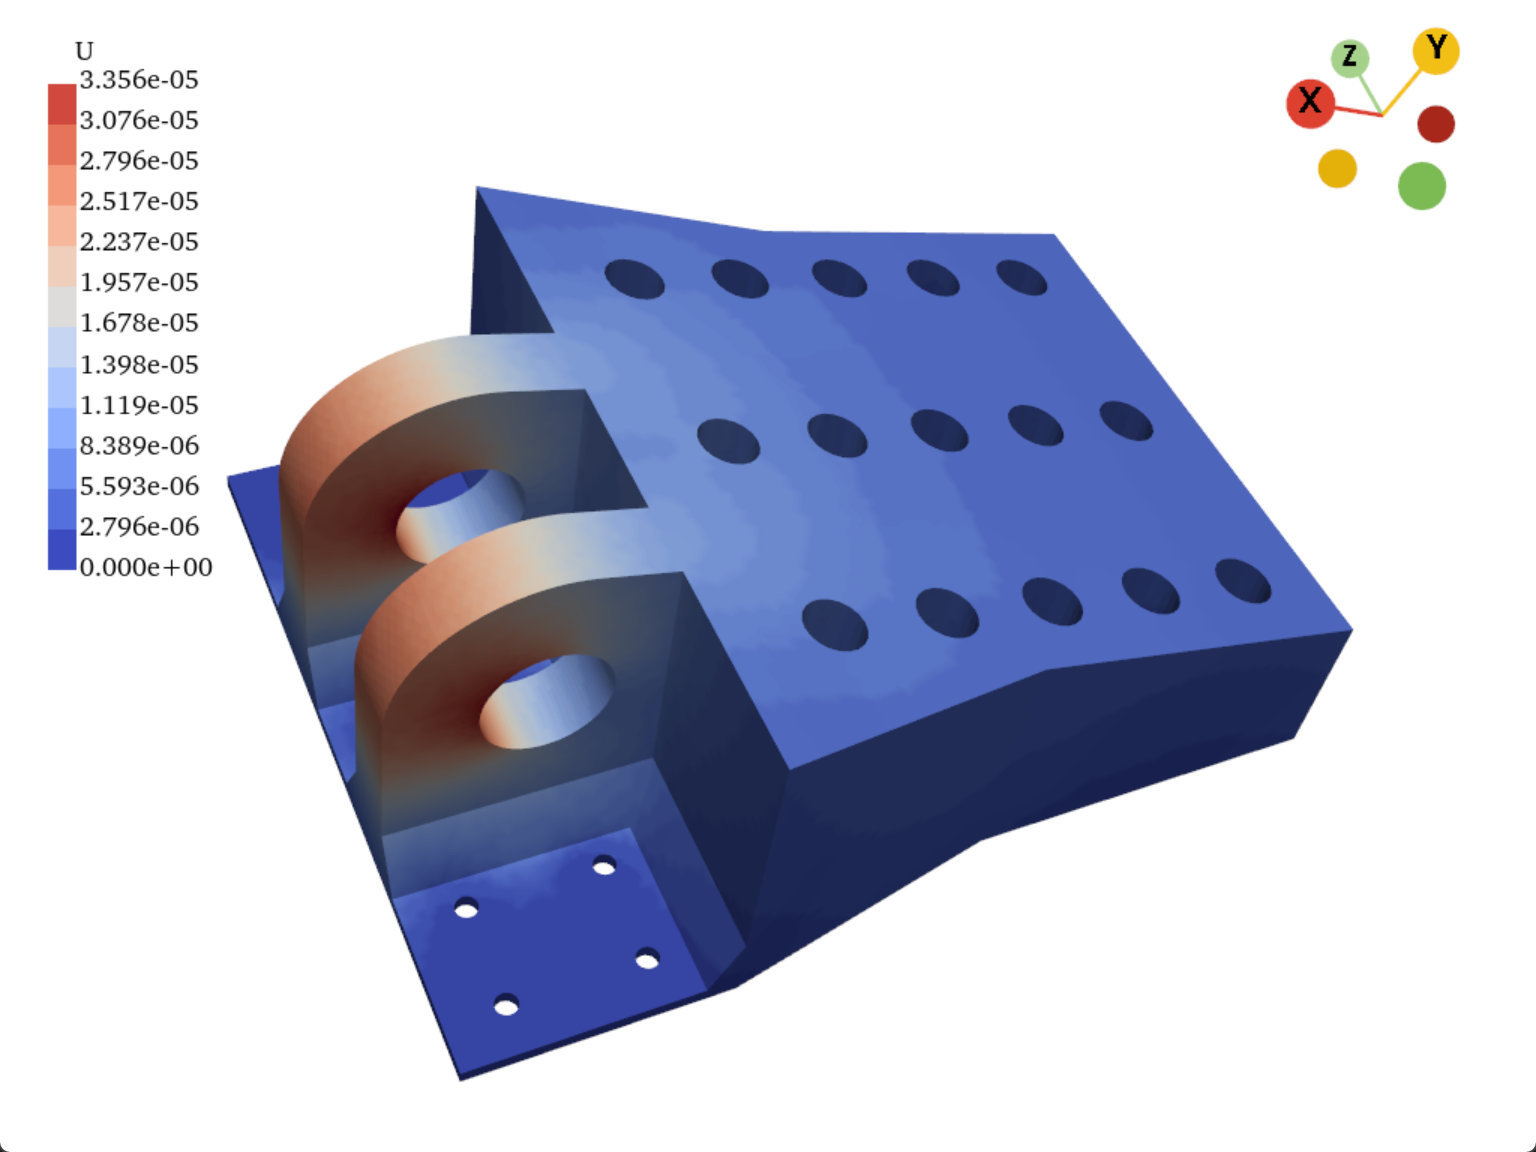
自定义colorbar&cmap
Tip
若要实现模型云图颜色分段效果,需要将matplotlib内置的cmap进行“分段处理”。
import pyvista as pv
import numpy as np
from matplotlib.colors import LinearSegmentedColormap
import matplotlib.pyplot as plt

def create_custom_cmap(cmap_name='coolwarm', num_colors=12):
    """
    根据给定的配色方案名称,创建一个归一化的LinearSegmentedColormap。

    :param cmap_name: 配色方案的名称(如 'coolwarm', 'jet', 'viridis' 等)
    :param num_colors: 配色方案中所需的颜色数量
    :return: 归一化后的LinearSegmentedColormap
    """
    # 获取指定的配色图
    cmap = plt.get_cmap(cmap_name, num_colors)

    # 获取颜色并进行归一化到 [0, 1] 范围
    cmap_normalized = cmap(np.linspace(0, 1, num_colors))[:, :3]  # 只保留RGB通道

    # 创建并返回自定义配色图
    return LinearSegmentedColormap.from_list(f'{cmap_name}_custom', cmap_normalized, N=num_colors)


cmap_name = 'jet' # cmap名称
num_colors = 12 # 需要间隔的颜色段数
custom_cmap = create_custom_cmap(cmap_name, num_colors)

mesh = pv.read('C3D4.vtk')
dargs = dict(
scalars="U",
show_scalar_bar=False,
# show_vertices=True,
# show_edges=True,
# edge_color='#000080',
# vertex_color='red',
# point_size=1,
cmap = custom_cmap,
# render_points_as_spheres=True
)
pl = pv.Plotter()
pl.add_mesh(mesh.copy(),**dargs)
pl.add_scalar_bar(title="U",n_labels=13,n_colors=12,fmt='%.3e',vertical=True,
width=0.05,position_x=0.03, position_y=0.5,font_family='times')
pl.show()
罗盘标志
缩放因子
嵌入PySide6
示例代码:
import sys
import pyvista as pv
from PySide6.QtWidgets import QApplication, QMainWindow, QVBoxLayout, QWidget
from pyvistaqt import QtInteractor
class MainWindow(QMainWindow):
def __init__(self):
super().__init__()
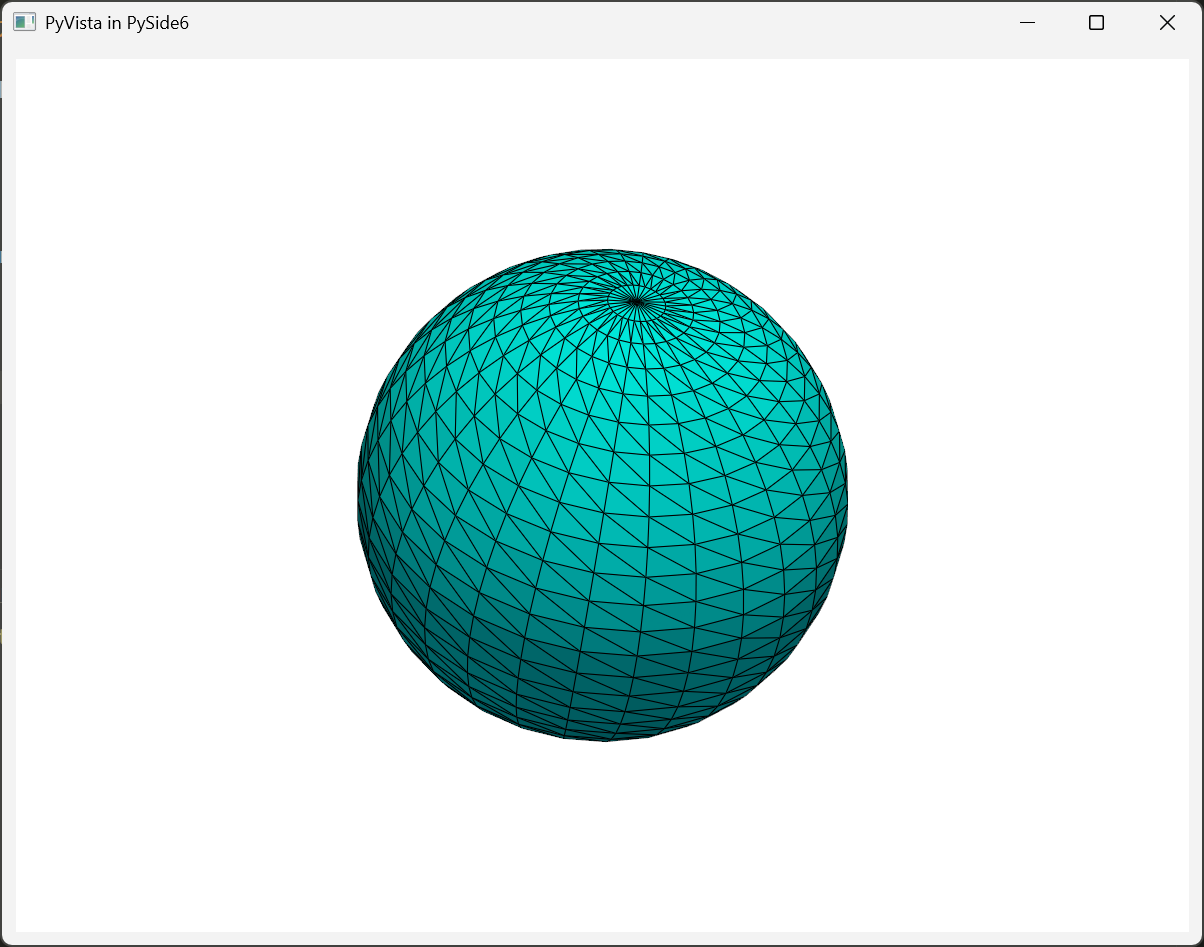
self.setWindowTitle("PyVista in PySide6")
self.setGeometry(100, 100, 800, 600)
# 创建一个 QWidget 作为中央窗口
self.central_widget = QWidget(self)
self.setCentralWidget(self.central_widget)
# 创建一个垂直布局
layout = QVBoxLayout()
self.central_widget.setLayout(layout)
# 创建 PyVista 渲染窗口
self.plotter = QtInteractor(self.central_widget)
layout.addWidget(self.plotter)
# 画一个示例 3D 对象
self.add_example_plot()
def add_example_plot(self):
sphere = pv.Sphere()
self.plotter.add_mesh(sphere, color="cyan", show_edges=True)
self.plotter.show()
if __name__ == "__main__":
app = QApplication(sys.argv)
window = MainWindow()
window.show()
sys.exit(app.exec())